Know what's happening.Before it breaks.
Endpoints, infrastructure, Kubernetes, metrics and logs, all connected in one clear view. Self-hosted, open source and ready in minutes.
Endpoints
12/12
Healthy
Infrastructure
8/8
Healthy
Kubernetes
6/6
Healthy
Services
4/4
Healthy
Request Latency
Uptime
99.98%
0.02%Avg Latency
128ms
32%Recent Logs
View all- INFO15:18:42[api] request completed 200 GET /healthfrontend
- WARN15:17:33[worker] high memory usage (78%)worker-1
- ERROR15:16:21[k8s] pod restarted: frontend-6f7d9fkubernetes
- INFO15:15:03[db] connection pool healthypostgres
Infrastructure
- Real-time metricsSee what matters, instantly
- Log aggregationFind issues faster
- Smart alertsStay ahead, always
- Kubernetes monitoringFrom nodes to pods
- Powerful dashboardsVisualize. Analyze. Resolve.
Product tour
See Pulsimo in action
Real screenshots from the Pulsimo console. Switch the theme to see them in light or dark.
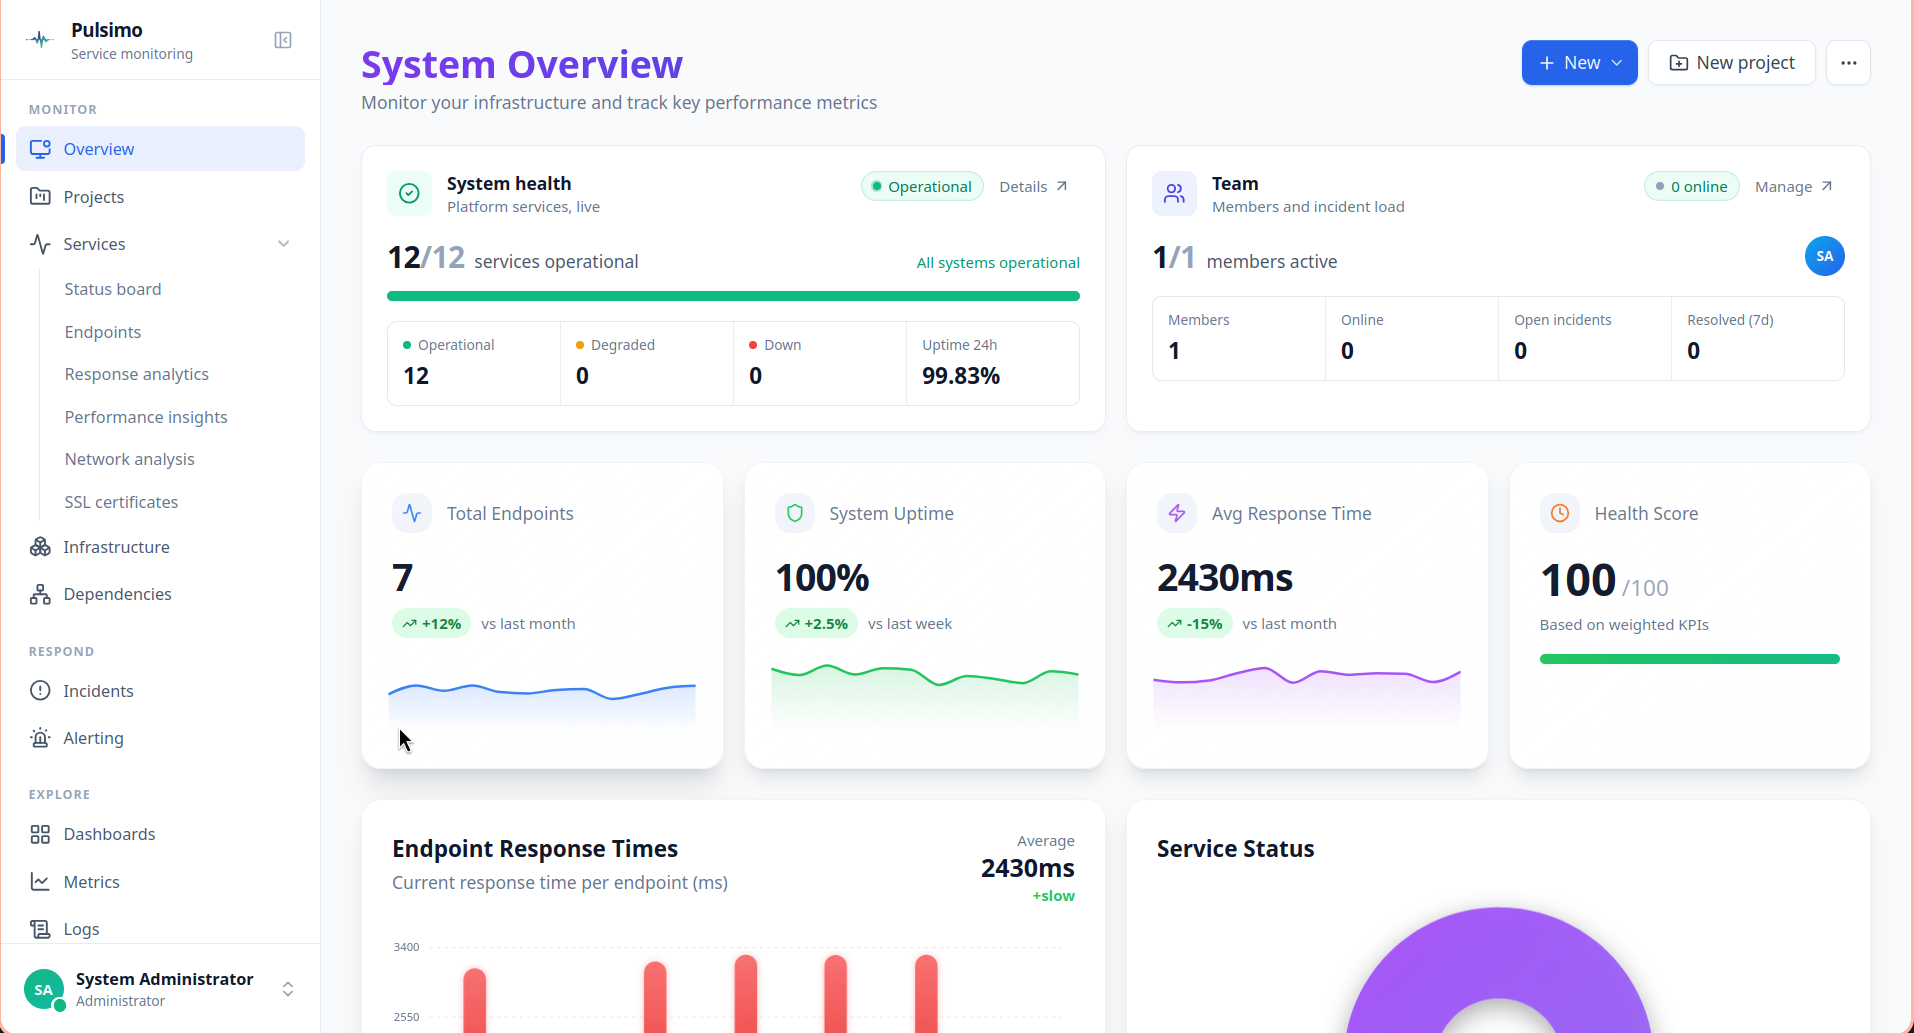
System Overview
Active incidents, system health, team status and key performance indicators at a glance
Features
Everything you need to see clearly
One place for the signals that matter, so you fix problems instead of hunting for them.
Endpoint monitoring
HTTP health checks every few seconds with uptime, p50/p95/p99 latency, Apdex and response-time breakdowns per endpoint.
Incident management
Failures open incidents automatically. Related ones are deduplicated and grouped so one outage never becomes fifty alerts.
Dependency mapping
Pulsimo discovers how your services call each other and shows the blast radius when one of them goes down.
Infrastructure & Kubernetes
Hosts, containers, nodes and pods from node_exporter, cAdvisor and Prometheus, right next to the endpoints they serve.
Log search
Search application logs, spot repeating patterns and jump from an error straight to the endpoint and incident behind it.
Alerts that reach you
Send alerts to email, Slack, Teams, Discord or any webhook, with maintenance windows and SSL expiry warnings built in.
- Self-hosted with Docker Compose
- Roles, permissions & API keys
- Your data stays on your servers
How it works
Up and running in minutes
No agents to install on every box and no SaaS account to create.
- 1
Deploy on your servers
Clone the repository and start the stack with Docker Compose. Your data never leaves your infrastructure.
- 2
Add what you run
Register endpoints, group them into projects and connect Prometheus, node_exporter or cAdvisor if you have them.
- 3
Know before your users do
Pulsimo checks everything continuously, opens incidents on failure and alerts the right channel immediately.
$ git clone https://github.com/Cloud-Council/pulsimo.git$ cd pulsimo && cp .env.example .env$ docker compose up -d✔ Container pulsimo-postgres Started✔ Container pulsimo-api Started✔ Container pulsimo-frontend Started$ open http://localhost:3000
Start monitoring in minutes
Pulsimo is free while in beta. Run it on your own servers and see every endpoint, node and log in one place.